Network Health
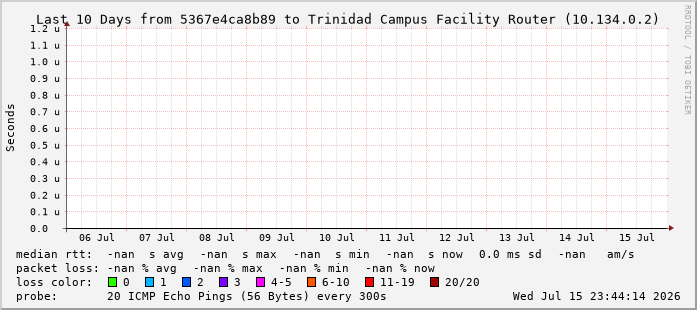
Continuous latency and packet-loss monitoring for our network at the Trinidad Campus in Quincy, WA, powered by SmokePing. Rather than a single snapshot, these graphs show performance over time so you can see whether a connection is consistently solid or just fast right now.
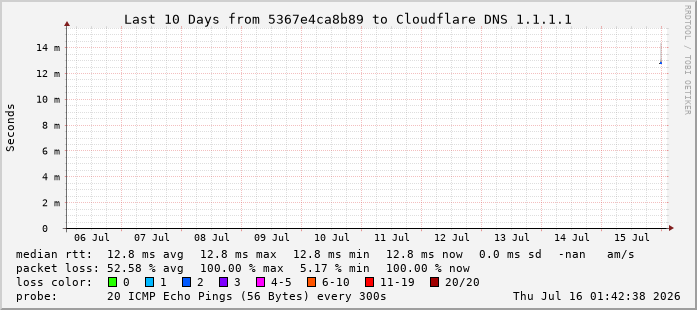
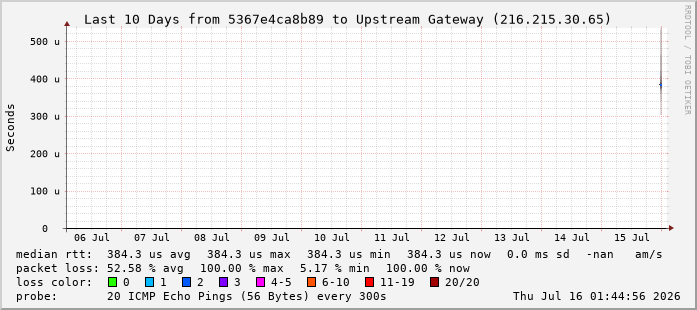
How to read these graphs: each graph plots round-trip latency (milliseconds) over time. A flat, low, consistent line means stable performance; spikes indicate temporary congestion or routing changes; a thickening "smoke" band around the line means latency is varying between individual pings (jitter), which is what SmokePing is named for. Click any graph to open the advanced interface for a zoomable, longer-range view.
What's normal: under 1 ms to our own core router, and roughly 5-15 ms to major public DNS anchors (Cloudflare, Google, Quad9) is typical for a well-connected network on the US West Coast. Consistently higher numbers, a widening smoke band, or non-zero packet loss over several hours are the signs worth watching for - a single dropped ping is normal internet noise, not a problem.
Internet Connectivity
Cloudflare DNS
…
Google DNS
…
Quad9 DNS
…
Internal Network
Core Router
…
Facility Router
…